Image Details
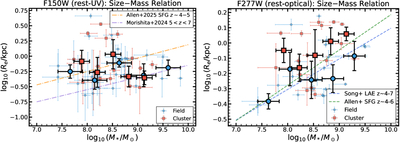
Caption: Figure 2.
Size–mass relations for LAEs in rest-UV (F150W, left panel) and rest-optical (F277W, right panel). Blue circles represent field LAEs, and red squares represent protocluster members. Large filled symbols show binned medians with bootstrap uncertainties. In the left panel (rest-UV), no systematic offset is detected between protocluster and field LAEs (field fit: β = 0.05 ± 0.08, scatter = 0.2 dex). For reference, the left panel includes rest-UV size–mass relations from N. Allen et al. (2025) for star-forming galaxies (SFGs) at 4 ≤ z < 5 (orange dashed–dotted line; from their Table A.1, F150W) and from T. Morishita et al. (2024) for galaxies at 5 < z < 14 (purple dashed–dotted line; evaluated at z = 4.9). In the right panel (rest-optical), protocluster LAEs systematically lie above the field relation, indicating larger sizes at fixed stellar mass. The median rest-optical size enhancement is ≃40% (cluster median Re = 0.81 kpc versus field 0.58 kpc). For reference, the right panel includes the rest-optical size–mass relations from Q. Song et al. (2026) for LAEs at z ≃ 4–7 (blue dashed line) and from N. Allen et al. (2025) for SFGs at z ≃ 4–6 (green dashed line). Field LAEs are broadly consistent with the Q. Song et al. (2026) LAE relation (Section 4.2).
Other Images in This Article
Copyright and Terms & Conditions
© 2026. The Author(s). Published by the American Astronomical Society.