Image Details
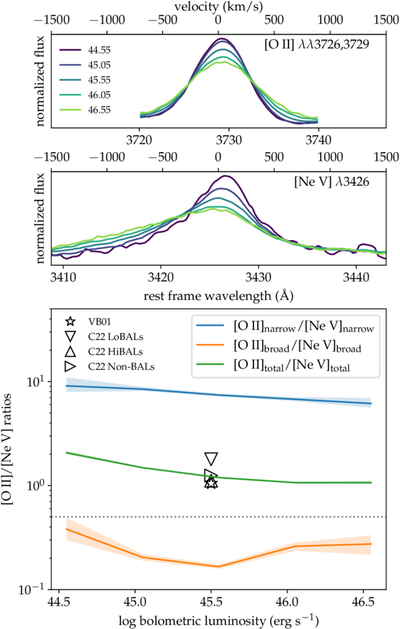
Caption: Figure 3.
[O II] and [Ne V] line profiles and flux ratios as a function of bolometric luminosity. Upper and middle panels: observed [O II] and [Ne V] line profiles in five bolometric-luminosity bins, normalized to the same integrated flux to facilitate comparison of line widths and shapes. Lower panel: [O II]/[Ne V] flux ratios for narrow components (blue), broad components (orange), and total flux (green). Previous total-flux measurements from D. E. Vanden Berk et al. (2001; star) and Z. Chen et al. (2022; triangles) are shown for comparison. The triangles from Z. Chen et al. (2022) represent nonbroad absorption line quasars (non-BALs), high-ionization BALs (HiBALs), and low-ionization BALs (LoBALs). The horizontal dotted line marks the flux ratio of 0.5 predicted by CLOUDY for AGN photoionization.
Other Images in This Article
Copyright and Terms & Conditions
© 2026. The Author(s). Published by the American Astronomical Society.