Image Details
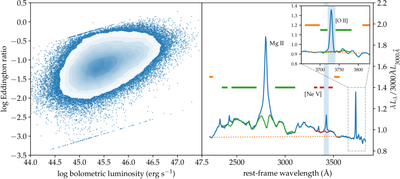
Caption: Figure 1.
Sample and spectral fitting methodology. Left panel: distribution of the full sample in the Lbol–λEdd parameter space. The apparent linear features formed by data points in the upper-left and lower-right corners arise from the truncation applied to the Mg II FWHM values in Q. Wu & Y. Shen (2022), and the affected sources represent only a negligible portion of the sample. Right panel: the composite spectrum of the full sample illustrating the continuum and Fe II subtraction procedure. In the main panel, the Fe II fitting includes three free parameters: the velocity dispersion and two independent amplitudes for the wavelength ranges 2200–3100 Å and 3250–3500 Å, respectively, with the interval 3100–3250 Å excluded from the fit (Z. Chen et al. 2022). The thick orange horizontal line indicates the fitting window for the power-law continuum. Green and red lines mark the wavelength ranges for two separate iron templates with independent amplitudes. The fitted continuum and iron components are shown in corresponding colors. The [O II] λλ3726,3729 doublet region is indicated by a gray dashed box in the main panel, with a zoomed-in view shown in the upper-right inset where a single iron template (green line) is used.
Other Images in This Article
Copyright and Terms & Conditions
© 2026. The Author(s). Published by the American Astronomical Society.