Image Details
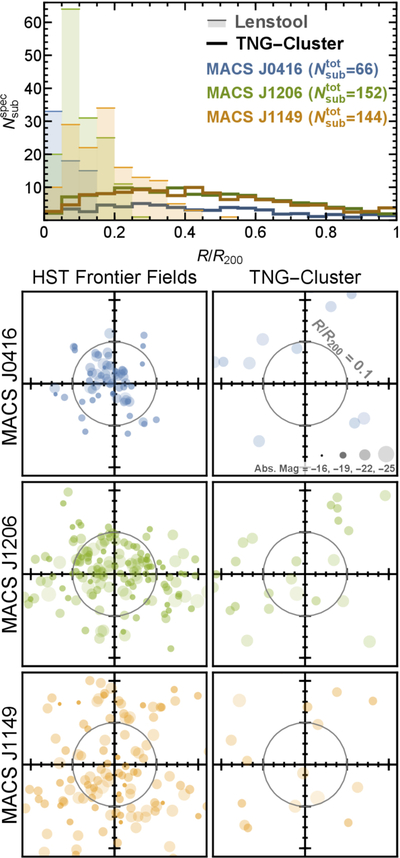
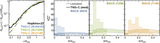
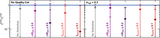
Caption: Figure 2.
Top: the projected radial distribution of subhalos associated with spectroscopically confirmed member galaxies in observed clusters (color-shaded) and in simulated analogs (solid lines; averaged over the five best-matched analogs and over three random projections). Bottom: the projected spatial distribution of subhalos around cluster centers in observations (left) and simulated analogs (right; from the best-mass-matched analog along a random projection), annotated by the respective absolute magnitude of associated galaxies. As compared to the observations, the simulated analogs clearly show a dearth of and fail to reproduce the spatial clustering of inner substructures within R/R200 ≲ 0.2.
Other Images in This Article
Copyright and Terms & Conditions
© 2026. The Author(s). Published by the American Astronomical Society.