Image Details
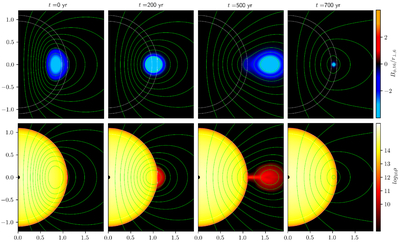
Caption: Figure 2.
Magnetic field evolution of the hyperactive magnetar. Four snapshots are shown at times t = 0, 200, 500, and 700 yr. The green curves represent poloidal magnetic field lines. The top row shows ﹩{B}_{\phi }/(r\sin \theta )﹩. The bottom row shows the log of baryon density ρ in units of g cm−3. In each panel, the horizontal x-axis shows the distance from the vertical z-axis (the axis of symmetry); both x and z are in units of 10 km. The inner and outer dashed white curves are contours of ρ = ρcore and ρ = ρdrip. The animation of this figure shows the sequence from t = 0–700 yr. The animation real-time duration is 15 s.
(An animation of this figure is available in the online article.)
(An animation of this figure is available.)
The video/animation of this figure is available in the online journal.
Other Images in This Article
Copyright and Terms & Conditions
© 2026. The Author(s). Published by the American Astronomical Society.