Image Details
Caption: Figure 3.
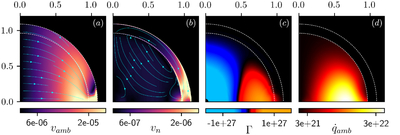
Snapshot of ambipolar diffusion at t = 200 yr. (a) Relative velocity between plasma and neutrons (ambipolar diffusion velocity) vamb in units of cm s−1. (b) Neutron velocity vn in units of cm s−1. (c) Rate of β-reactions Γ in units of s−1 cm−3 (red corresponds to neutron production, and blue corresponds to electron–proton production). (d) Ambipolar heating rate ﹩{\dot{q}}_{\mathrm{amb}}﹩ in units of erg s−1 cm−3. The axes are the same as in Figure 1. The dashed white curves are the contours of ρ = ρcore and ρ = ρdrip. The animation of this figure shows the sequence from t = 0–700 yr. The animation real-time duration is 15 s.
(An animation of this figure is available in the online article.)
(An animation of this figure is available.)
The video/animation of this figure is available in the online journal.
Other Images in This Article
Copyright and Terms & Conditions
© 2026. The Author(s). Published by the American Astronomical Society.