Image Details
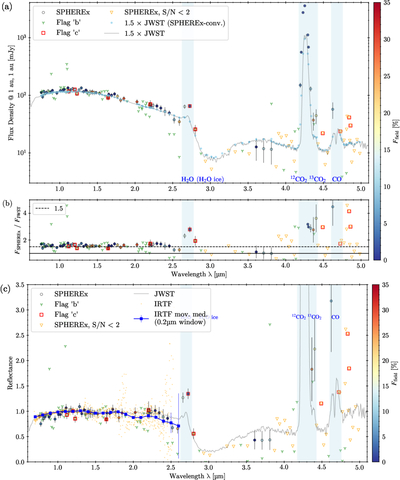
Caption: Figure 2.
(a) The flux density of the 2025 August measurements, scaled to a distance corrected geometry of robs = rhel = 1 au. The JWST measurements (M. A. Cordiner et al. 2025) are scaled by a constant factor of 1.5 to match the SPHEREx measurements. For flags, see Table 1 in the Appendix and text for explanation. The sky blue points are the JWST measurements, convolved with the pixel spectral throughput at the SPHEREx pixel for that observation, using the SPHEREx Sky Simulator (H. Hui et al. 2024; B. P. Crill et al. 2025). Blue shades indicate important spectral features. Colors of “good” measurements indicate Ffield (Equation (1)). (b) The distance-corrected ratio of the SPHEREx to JWST flux, showing that SPHEREx measurements are systematically higher than JWST ones. This indicates the spatial extendedness of the object, 3I. The error bars are not shown for data with S/N < 2. (c) The reflectance, normalized at 1.2 μm for the SPHEREx, JWST, and the IRTF measurements. The blue line shows the moving median of the IRTF data with a 0.2 μm window.
Other Images in This Article
Copyright and Terms & Conditions
© 2026. The Author(s). Published by the American Astronomical Society.