Image Details
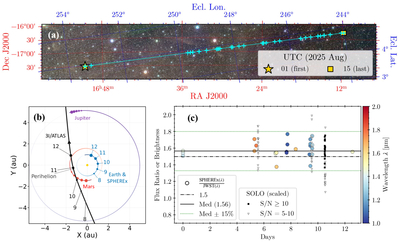
Caption: Figure 1.
Motion of 3I. (a) Color composite created from SPHEREx data using 1.185, 1.716, and 2.194 μm imagery for red, green, and blue, respectively. The trajectory of 3I is overplotted, with observed positions marked by aqua crosses. The starting and ending points of our dataset are indicated separately (see legend). (b) Orbital motion of 3I (black) projected onto the ecliptic plane. The orbits of Earth, Mars, and Jupiter are shown in blue, red, and purple, respectively. Numbers indicate the positions of the bodies on the first day of each month. 3I’s retrograde motion and perihelion are marked with arrows. (c) Lightcurve of 3I produced by taking all λ = 1.0–1.8 μm SPHEREx flux measurements and dividing them by the JWST flux (Figure 2(b); M. A. Cordiner et al. 2025) to leave only lightcurve variations. Also included are SOLO clear-filter brightness measurements scaled to match their median to that of the SPHEREx/JWST ratio. The resulting lightcurve amplitude is within ±15%, so the derived reflectance should be correct to within this range considering any lightcurve modulation effects.
Other Images in This Article
Copyright and Terms & Conditions
© 2026. The Author(s). Published by the American Astronomical Society.