Image Details
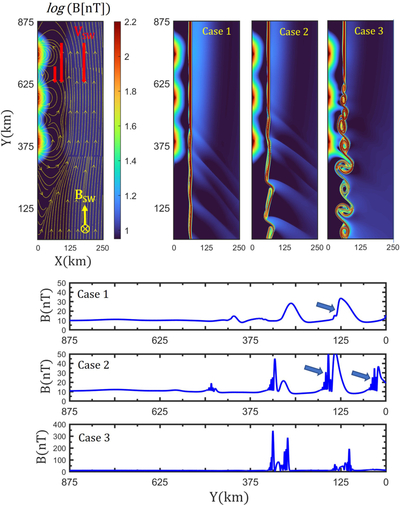
Caption: Figure 3.
Simulation results showing the nonlinear evolution of the KHI. The leftmost panel displays the equilibrium magnetic field magnitude on a logarithmic scale, with yellow lines as field lines and red arrows indicating solar-wind flow over three subsurface dipoles. The three panels to the right show nonlinear outcomes for Cases 1–3 with decreasing solar-wind speeds. KHI-driven fast-mode shocks form and extend upward in Cases 1–2, while Case 3 yields large-amplitude vortex structures. The lower three panels show magnetic variations at 100 km altitude, demonstrating upstream-steepened profiles for shock-like EMEs (blue arrows indicating the steepened side) and strongly oscillatory signatures for vortex-type EMEs.
Other Images in This Article
Copyright and Terms & Conditions
© 2026. The Author(s). Published by the American Astronomical Society.