Image Details
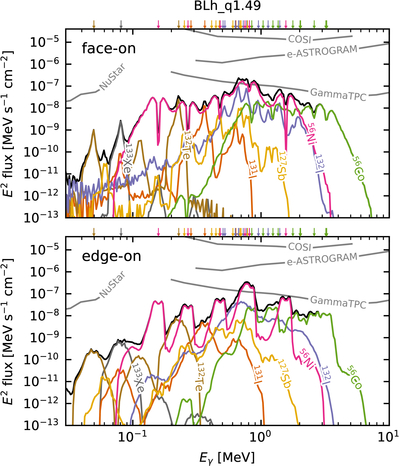
Caption: Figure 4.
γ-ray emission spectrum at t = 7 days for BLh_q1.49 at 40 Mpc for a polar (upper panel) and an equatorial (lower panel) viewing angle. Colored lines and arrows on top of the panels indicate the contribution of individual isotopes and the original line positions, respectively. Gray lines show the sensitivity of the NuStar, COSI, e-ASTROGRAM, and GammaTPC telescopes.
Other Images in This Article
Copyright and Terms & Conditions
© 2026. The Author(s). Published by the American Astronomical Society.
Copyright ©
2026 Astronomy Image Explorer. All Rights Reserved.