Image Details
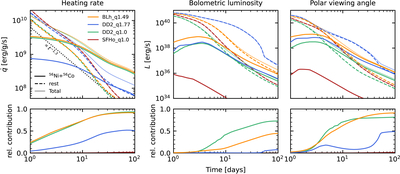
Caption: Figure 3.
Mass-averaged nuclear energy generation (left panels), bolometric luminosity (middle panels) and luminosity observed at a viewing 20∘ (right panels). The upper panels show the heating and luminosities generated by the decay of 56Ni and 56Co (solid lines), the contribution of all remaining isotopes (dashed lines), and the total (thin lines). The dotted black line in the upper left panel indicates a heating rate proportional to t−1.3. The lower panels show the relative contribution of 56Ni and 56Co in each of the above panels.
Other Images in This Article
Copyright and Terms & Conditions
© 2026. The Author(s). Published by the American Astronomical Society.
Copyright ©
2026 Astronomy Image Explorer. All Rights Reserved.