Image Details
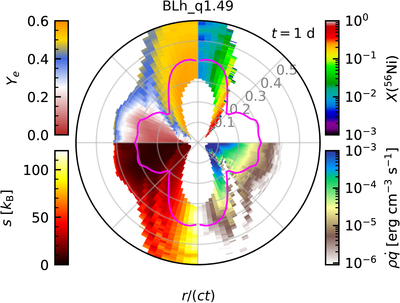
Caption: Figure 2.
Spatial distribution of the ejecta of the BLh_q1.49 model after 1 day. Top-left quadrant: electron fraction at the beginning of the SNEC simulation. Top-right quadrant: mass fraction of 56Ni. Bottom-left quadrant: initial entropy at the beginning of the SNEC simulation. Bottom-right quadrant: local heating rate. The magenta line indicates the position of the photosphere. Regions with Ye ≳ 0.48 and s ≲ 50kB/baryon produce a large amount of 56Ni, which has a significant impact on the heating rate on the timescale of days.
Other Images in This Article
Copyright and Terms & Conditions
© 2026. The Author(s). Published by the American Astronomical Society.
Copyright ©
2026 Astronomy Image Explorer. All Rights Reserved.