

Image Details
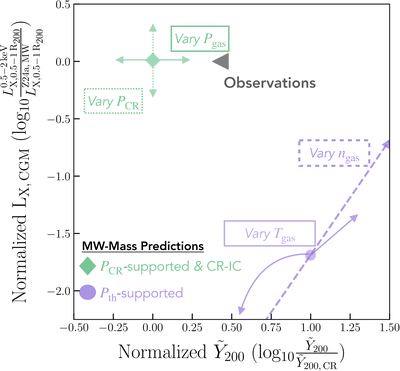
Caption: Figure 4.
Joint X-ray and tSZ observations constrain CGM pressure: log10 LX,CGM vs. log10 ﹩{\tilde{Y}}_{200}﹩ for an MW-mass halo at z = 0.08 (M200,12 = 1.26), here normalized to the integral of the best-fit MW-mass XSB profile of Z24a between 0.5R200 and 1R200 (≈100–200 kpc) and to our ﹩{\tilde{Y}}_{200}﹩ predictions for a PCR-dominated halo (Equation (5)), respectively. The LX prediction for a PCR-dominated halo (green diamond) with ﹩{\dot{E}}_{40}=0.66,\,{v}_{100}=1﹩ lies close to the Z24a best-fit value, while in agreement with the tSZ upper limit at M200,12 = 1.25−2.59 from S. Das et al. (2025; black triangle), while the Pth-dominated halo (purple circle) is over 1 dex too high in ﹩{\tilde{Y}}_{{\rm{200}}}﹩. Varying ngas or Tgas (purple dashed and solid lines) necessarily moves Pth-dominated predictions in the wrong directions relative to the observational constraints, whereas changing PCR or Pgas (green dotted and solid annotations) moves PCR-dominated model predictions in orthogonal directions in this plane, allowing for models to meet observational constraints.
Other Images in This Article
Copyright and Terms & Conditions
© 2026. The Author(s). Published by the American Astronomical Society.

