

Image Details
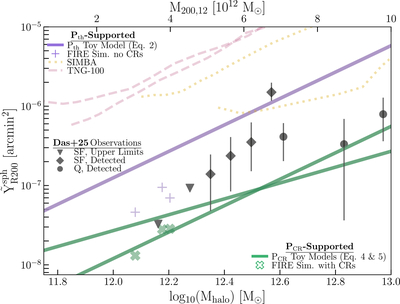
Caption: Figure 2.
Analytic and simulation predictions for ﹩{\tilde{Y}}_{{\rm{200}}}﹩ vs. log10(Mhalo). The analytic prediction for Pth-dominated halos (purple solid line) lies factors of several times above the upper limits and star-forming or quenched detections at low and high Mhalo of S. Das et al. (2025; black triangles, diamonds, and circles), whereas predictions for PCR-dominated halos (green solid lines) can lie along the observations at low and high Mhalo, though the intermediate mass datapoints log10(Mhalo) ∈ [12.3–12.6] are in between analytic predictions. Similarly, Pth-dominated simulations like SIMBA (gold dotted lines) and TNG (red dashed lines) generally overpredict ﹩{\tilde{Y}}_{{\rm{200}}}﹩ for quenched and star-forming galaxies by over a dex. Meanwhile, PCR-dominated FIRE simulations (m12i,f,m in order of Mhalo; green crosses) are in agreement with upper limits, whereas the same halos without CRs, instead Pth dominated (purple plus signs), lie above.
Other Images in This Article
Copyright and Terms & Conditions
© 2026. The Author(s). Published by the American Astronomical Society.

