Image Details
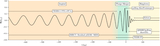
Caption: Figure 13.
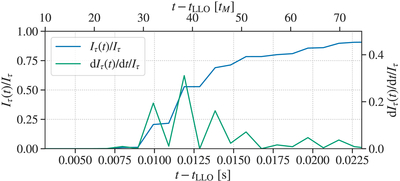
The accumulation of Fisher information about the ﹩\delta {\hat{\tau }}_{220}﹩ parameter over time (partial sums in blue and terms in the sum in green from the final term in Equation (6)) for a DS model with f = 250 Hz and τ = 3.5 ms, starting at t − tLLO = 10tM. Each peak of the green curve corresponds to a peak or trough of the waveform shown in Figure 12, with the highest peak corresponding to the cycle of the signal indicated by the purple arrow in that figure. A DS analysis in the time domain is thus particularly sensitive in its damping time estimate to the times that seem to drive the deviation identified in the pSEOBNR analysis at t − tLLO = 9 ms.
Other Images in This Article
Show More
Copyright and Terms & Conditions
© 2026. The Author(s). Published by the American Astronomical Society.