Image Details
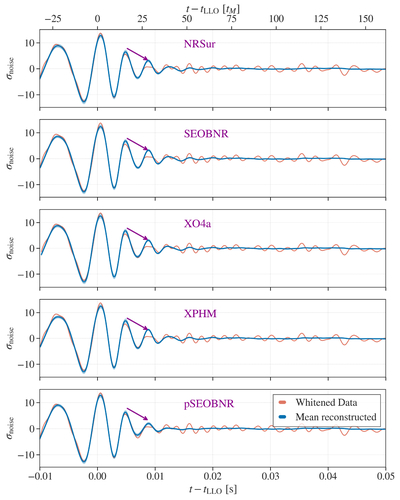
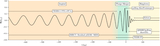
Caption: Figure 12.
Comparison of whitened data and reconstructed waveforms. The shaded bands around the mean encompass 90% of the waveforms reconstructed from the posterior distribution. The first four panels show the four named GR waveforms, whereas the fifth shows the non-GR pSEOBNR waveform. The additional freedom in the pSEOBNR waveform enables it to better capture features in the data compared to the four GR waveforms, most notably by producing a quicker-than-expected amplitude decay. This is particularly notable at the time indicated by the arrows, t − tLLO ≈ 0.085 s, where the GR waveforms all deviate noticeably from the data and consistently predict a higher-than-observed strain. This feature may be explained by a random fluctuation in the detector noise; similar fluctuations can be observed at later times (e.g., after t − tLLO = 0.04 s, when no remaining detectable signal is expected).
Other Images in This Article
Show More
Copyright and Terms & Conditions
© 2026. The Author(s). Published by the American Astronomical Society.