Image Details
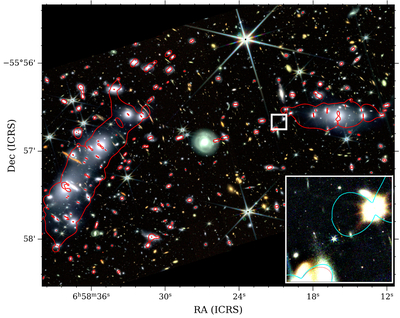
Caption: Figure 4.
RGB (F277W, F357W, and F444W) image of the Bullet Cluster. Overlaid (in red) is the critical curve calculated at the redshift of BulletArc-z11 used in this Letter. In the inset (10″ × 10″), we use high-resolution RGB images (F115W, F150W, and F200W) to show BulletArc-z11 and the same red critical curve as well as in cyan the one with a cluster member added as described in Section 3.3.
Other Images in This Article
Copyright and Terms & Conditions
© 2025. The Author(s). Published by the American Astronomical Society.
Copyright ©
2025 Astronomy Image Explorer. All Rights Reserved.