Image Details
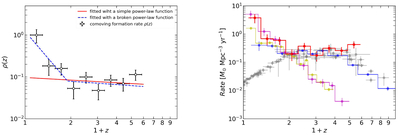
Caption: Figure 4.
Left: comoving formation rate ρ(z) of FXTs obtained from Equation (6). It is normalized to unity at the first point, and the 1σ error is also shown. The solid and dashed lines represent the single and double power-law forms of ρ(z), respectively. Right: comparison between the formation rate of FXTs and other events. The red line represents the formation rate of FXTs. The yellow and blue lines represent the rates of short GRBs (G. Q. Zhang & F. Y. Wang 2018) and LGRBs (H. Yu et al. 2015), respectively. The magenta line is the rates of FRBs (J. H. Chen et al. 2024). The gray dots correspond to the observed SFR (A. M. Hopkins & J. F. Beacom 2006; L.-X. Li 2008). Note that all formation rates are normalized at a redshift of ∼1.
Other Images in This Article
Copyright and Terms & Conditions
© 2025. The Author(s). Published by the American Astronomical Society.