Image Details
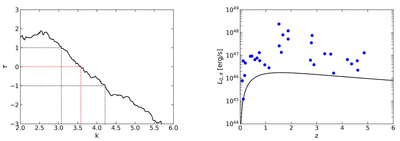
Caption: Figure 2.
Left: value of test statistic τ as a function of k. The red dotted line is the best fit for τ = 0, and the black dotted lines represent 1σ errors. The optimal value is ﹩k=3.5{8}_{-0.51}^{+0.63}﹩ at a 1σ confidence level. Right: nonevolving luminosity L0,X = LX/(1 + z)3.58 of 31 FXTs. The black solid line represents the observational limit considering the impact of k.
Other Images in This Article
Copyright and Terms & Conditions
© 2025. The Author(s). Published by the American Astronomical Society.
Copyright ©
2025 Astronomy Image Explorer. All Rights Reserved.