Image Details
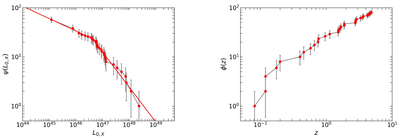
Caption: Figure 3.
Left: cumulative luminosity function ψ(L0,X). The scatter represents the cumulative number (N) with 1σ error (﹩\sqrt{N}﹩), and the red line represents the best fit with a broken power-law model with the low-end index of 0.25 ± 0.01 and the high-end index of 0.71 ± 0.03, and the break luminosity is 4.17 ± 0.34 × 1046 erg s−1. Right: cumulative redshift distribution of FXTs, ϕ(z).
Other Images in This Article
Copyright and Terms & Conditions
© 2025. The Author(s). Published by the American Astronomical Society.
Copyright ©
2025 Astronomy Image Explorer. All Rights Reserved.