Image Details
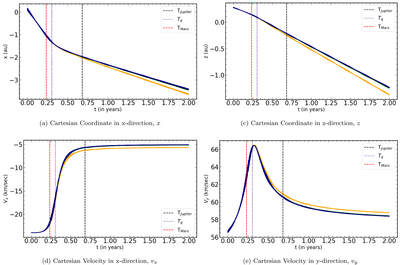
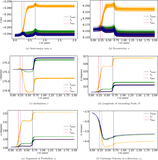
Caption: Figure 6.
Variation of the Cartesian coordinates, x, and z, and the Cartesian velocities, vx, and vy. In each panel, the orange curves represent nongravitational accelerations of 10−5 au day−2, and the green, brown, and navy-blue curves represent nongravitational accelerations of 10−6, 10−7, and 10−8 au day−2. Here, we plotted the behavior of 50 clones to keep the image size manageable.
Other Images in This Article
Copyright and Terms & Conditions
© 2025. The Author(s). Published by the American Astronomical Society.
Copyright ©
2025 Astronomy Image Explorer. All Rights Reserved.