Image Details
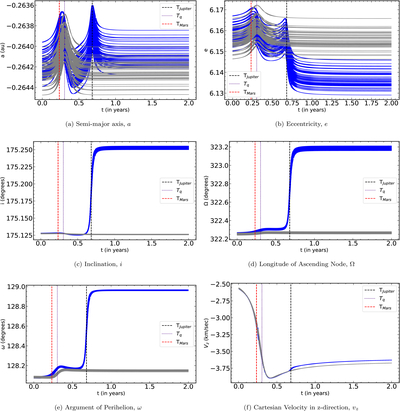
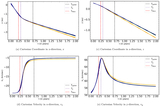
Caption: Figure 2.
Variation of orbital parameters and the Cartesian velocity in the z-direction. In each panel, the gray curves are for the simulation without considering interactions with Mars and Jupiter, whereas the blue curves include these planets. The vertical red and black dashed lines represent the date at which the comet is close to Mars and Jupiter. The vertical dotted lines in indigo represent the time of perihelion. Here, we plotted the behavior of 50 clones to keep the image size manageable.
Other Images in This Article
Copyright and Terms & Conditions
© 2025. The Author(s). Published by the American Astronomical Society.
Copyright ©
2025 Astronomy Image Explorer. All Rights Reserved.