

Image Details
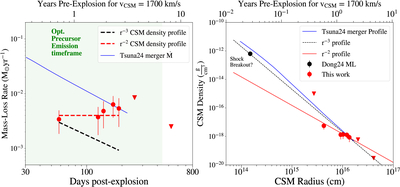
Caption: Figure 5.
The mass-loss picture of SN 2023fyq that we derive based on our radio modeling. Left: derived effective mass-loss rate as a function of days after explosion, as well as years before explosion, assuming the observed CSM speed of 1700 km s−1. We denote the period over which optical precursor emission (at signal-to-noise ratio > 3) was detected (S. J. Brennan et al. 2024), to illustrate how the precursor outbursts may have been creating the CSM we observe in the radio. No precursor data could be obtained beyond 7 yr before the explosion, since the Zwicky Transient Facility/ATLAS surveys had not started then. Right: CSM density associated with the mass-loss rate as a function of the CSM radius. We also show r−3 and r−2 density profiles, along with profiles from merger simulations by D. Tsuna et al. (2024). Our data suggest enhanced mass loss, with a sudden drop between 5 and 8 yr before the explosion revealed by our upper limit. We emphasize that some jump in density, potentially due to shock breakout, would be needed to consistently explain our data points and the early data point from Y. Dong et al. (2024) in the r−2 case. Our last 3σ upper limits are consistent with the D. Tsuna et al. (2024) density profile extrapolation, given that this profile assumes that the mass loss starts directly at 4 yr before the explosion (for our assumed CSM speed).
Other Images in This Article
Copyright and Terms & Conditions
© 2025. The Author(s). Published by the American Astronomical Society.

