

Image Details
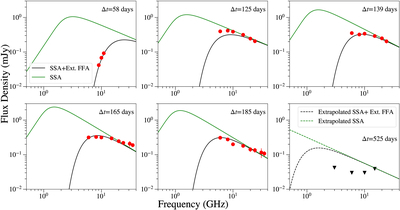
Caption: Figure 4.
Radio SEDs of SN 2023fyq at Δt ≈ 58–525 days. The downward triangles represent 3σ flux density upper limits. The solid black lines denote the overall SSA+ external FFA model we derive self-consistently (see Section 3.1). The solid green lines denote the intrinsic SSA model using the calculated Fp/νp from Equation (5). The values of the best-fit parameters are displayed in Table 2. We also show the extrapolated models with dashed black and green lines at Δt ≈ 525 days with the flux density upper limits, to emphasize the discrepancy between the models and the nondetections, indicating a decrease in the mass-loss rate at ∼ 5–10 yr before the explosion.
Other Images in This Article
Copyright and Terms & Conditions
© 2025. The Author(s). Published by the American Astronomical Society.

