Image Details
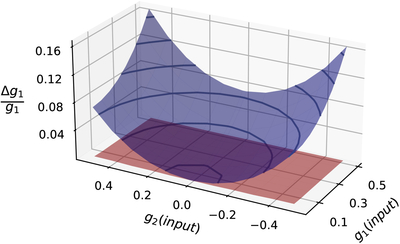
Caption: Figure 1.
An example showing the behavior of the shear bias when the shear signals become large. The blue and red surfaces refer to the results of the FQ and FQN methods, respectively. The contours correspond to the values of 0.005, 0.035, 0.065, 0.095, 0.125, and 0.155 respectively.
Other Images in This Article
Copyright and Terms & Conditions
© 2025. The Author(s). Published by the American Astronomical Society.
Copyright ©
2025 Astronomy Image Explorer. All Rights Reserved.