Image Details

Caption: Figure 2.
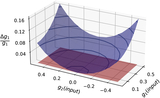
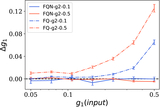
An example of the shear errors in regular galaxies at SNR = 40. Different colors in the plots represent different g2 (g1) input values. The dotted–dashed curves correspond to the FQ results, while the solid lines correspond to the FQN results. The black dashed line indicates the zero baseline for comparison.
Other Images in This Article
Copyright and Terms & Conditions
© 2025. The Author(s). Published by the American Astronomical Society.
Copyright ©
2025 Astronomy Image Explorer. All Rights Reserved.