Image Details
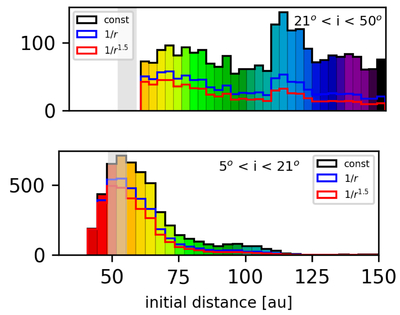
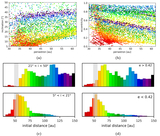
Caption: Figure B1.
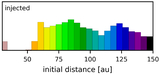
Surface density dependence. Origin of the high- and low-inclination TNOs as in Figure 2(d). However, here we show a comparison of the test particle distribution (black), with those assuming a 1/r (blue) and a 1/r3/2 (red) surface distribution in the preflyby disk.
Other Images in This Article
Copyright and Terms & Conditions
© 2025. The Author(s). Published by the American Astronomical Society.
Copyright ©
2025 Astronomy Image Explorer. All Rights Reserved.