Image Details
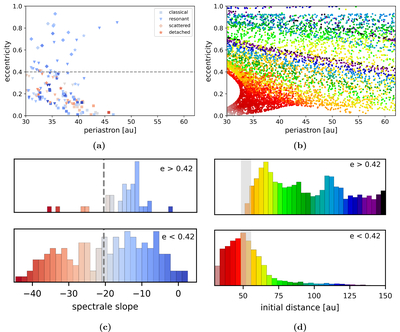
Caption: Figure 3.
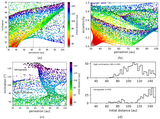
Connection between TNO color and eccentricity. The left column illustrates the observational data of M. Ali-Dib et al. (2021) and M. Marsset et al. (2019), and the right column shows the numerical results from our flyby simulation. Panels (a) and (b) display scatter plots of the TNOs’ eccentricity as a function of periastron distance. Panels (c) and (d) show the corresponding color distributions distinguishing between objects with e > 0.42 and e < 0.42. The colors in panels (b) and (d) are as defined in Figure 1(a). For the data of M. Marsset et al. (2019) we excluded the centaurs.
Other Images in This Article
Copyright and Terms & Conditions
© 2025. The Author(s). Published by the American Astronomical Society.
Copyright ©
2025 Astronomy Image Explorer. All Rights Reserved.