Image Details
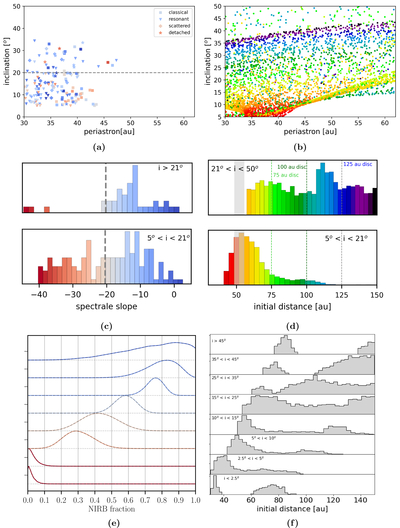
Caption: Figure 2.
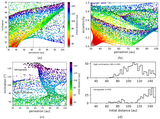
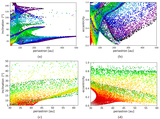
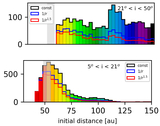
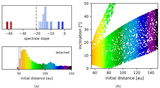
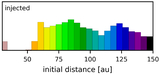
Connection between TNO color and inclination. The left column illustrates the observational data of M. Marsset et al. (2019) and P. H. Bernardinelli et al. (2025), and the right column shows the numerical results from our flyby simulation. The top row displays scatter plots of the TNOs’ inclination as a function of periastron distance. The middle row shows color distributions for the high-inclination (i > 21°) and the low-inclination (5° < i < 21°) objects, respectively. The colors in panels (b) and (d) indicate the distance to the Sun in the preflyby disk as defined in Figure 1(a). The colors can also be used to convert the results to smaller initial disk sizes. The vertical lines in panel (c) correspond to the gray area in panel (d) and show the border between very red and gray TNOs in the observations and simulations. For the data of M. Marsset et al. (2019) we excluded the centaurs. (e) Observations of the fraction of infrared bright objects as a function of inclination bin for the classical TNOs in the DES survey (P. H. Bernardinelli et al. 2025). (f) Simulation results of the origin distribution for the same inclination bins. Only objects with 30 < p < 60 au are considered.
Other Images in This Article
Copyright and Terms & Conditions
© 2025. The Author(s). Published by the American Astronomical Society.