Image Details
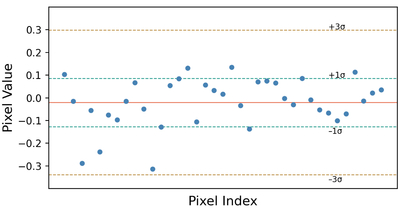
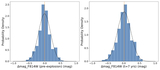
Caption: Figure 2.
Values of pixels within the SN’s positional error in the difference image shown in Figure 1(c). The solid red line marks the zero level, while the dashed lines indicate ±1σ (teal) and ±3σ (brown) thresholds. As illustrated in the figure, no signal is detected beyond the 3σ level.
Other Images in This Article
Copyright and Terms & Conditions
© 2025. The Author(s). Published by the American Astronomical Society.
Copyright ©
2025 Astronomy Image Explorer. All Rights Reserved.