Image Details
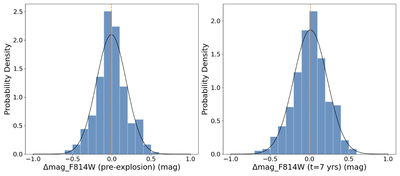
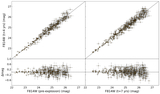
Caption: Figure 5.
Histograms of magnitude differences for common stars in the SN 2012ec field (relative to the t = 4 yr epoch). The solid lines are Gaussian fit curves and the dashed lines represent the means of the Gaussian fit. Normalization has been applied to each graph.
Other Images in This Article
Copyright and Terms & Conditions
© 2025. The Author(s). Published by the American Astronomical Society.
Copyright ©
2025 Astronomy Image Explorer. All Rights Reserved.