Image Details
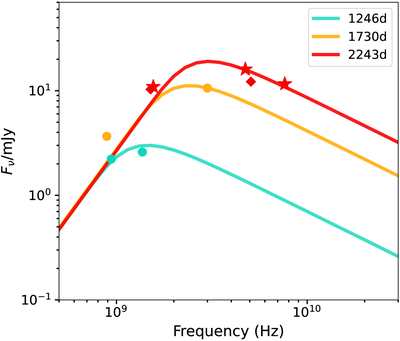
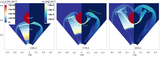
Caption: Figure 6.
Hydrodynamic modeling of the radio SEDs of AT2018cqh. The cyan, orange, and red lines correspond to the model SEDs at δt = 1246, 1730, and 2243 days in the observer’s frame, respectively. The filled circles, stars, and diamonds represent the observed flux densities, as shown in Figure 3.
Other Images in This Article
Copyright and Terms & Conditions
© 2025. The Author(s). Published by the American Astronomical Society.
Copyright ©
2025 Astronomy Image Explorer. All Rights Reserved.