Image Details
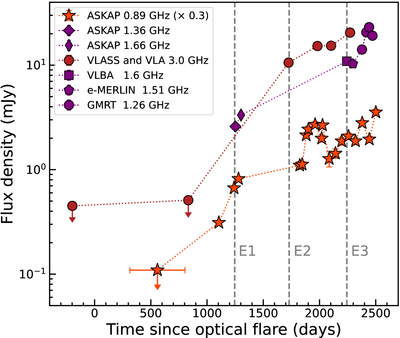
Caption: Figure 2.
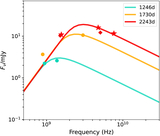
The radio light curves of AT2018cqh, including the data from the ASKAP observations at 0.89 GHz, 1.36 GHz, and 1.66 GHz, the e-MERLIN observations at 1.51 GHz, the VLASS observations at 3 GHz, the VLBA observations at 1.56 GHz, and the VLA observations at 3.0 GHz (Section 3.2). The radio emission appears later relative to the time of optical discovery (MJD = 58285) and shows a continuous rising in flux that can vary on timescales down to ∼2 months. For the nondetections, the corresponding 3σ upper limits on flux density are shown. The vertical dashed lines represent the three epochs for which the radio SED can be constrained (Figure 3), corresponding to 1246, 1730, and 2243 days after the optical discovery, respectively.
Other Images in This Article
Copyright and Terms & Conditions
© 2025. The Author(s). Published by the American Astronomical Society.