

Image Details
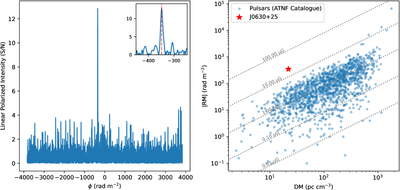
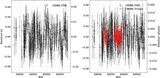
Caption: Figure 3.
Left: FDF of the single polarized detection of CHIME J0630+25 showing linear polarized intensity as a function of the trial Faraday depths, ϕ. Inset plot highlights the FDF peak near an RM ∼ −350 rad m−2. Right: DM–∣RM∣ distribution of the Galactic pulsar sample (blue points; ATNF Catalog) vs. the equivalent measurement from CHIME J0630+25 (red star). Diagonal gray lines indicate different magnetic field strengths (0.01,0.1,1,10,100 μG) determined from the relation, ﹩{B}_{\parallel }=1.23\frac{| {\rm{RM}}| }{{\rm{DM}}}\ \mu {\rm{G}}﹩.
Other Images in This Article
Copyright and Terms & Conditions
© 2025. The Author(s). Published by the American Astronomical Society.

Copyright ©
2026 Astronomy Image Explorer. All Rights Reserved.
