

Image Details
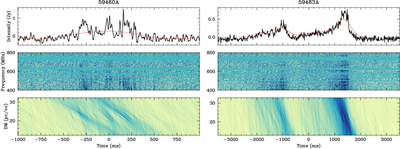
Caption: Figure 1.
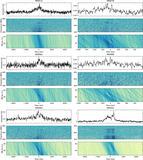
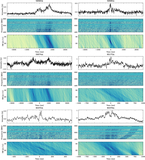
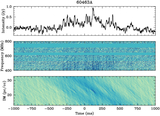
Two pulses from CHIME J0630+25 detected by CHIME/Pulsar. The top panel for each burst contains frequency-averaged and dedispersed time series. The red line is the smoothed profile. The plots are not necessarily centered on the extracted TOA; rather, the center is chosen to best show the burst morphology. The second panel shows the dynamic spectrum of each burst, and the bottom panel shows the dedispersion heat map for each burst. The dedispersion heat map shows the power for many different DM trials. All astrophysical pulses of CHIME J0630+25 center on DM ≈ 22pc cm−3.
Other Images in This Article
Copyright and Terms & Conditions
© 2025. The Author(s). Published by the American Astronomical Society.

Copyright ©
2026 Astronomy Image Explorer. All Rights Reserved.
