Image Details
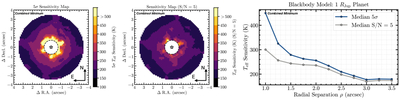
Caption: Figure 5.
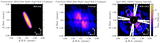
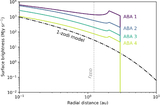
Left: 2D 5σ planet effective BB temperature sensitivity map, combined across all epochs by selecting the best sensitivity (“combined minimum,” see Paper II ), in sky coordinates (north up, east left). The central region (<0﹩\mathop{.}\limits^{^{\prime\prime} }﹩75, or <1.5 FWHM, radial separations) is masked (poor detectability). A discrete color map is chosen to highlight the different sensitivity zones across the image. Center: same as the left panel but for an S/N = 5 detection threshold. Right: 5σ and S/N = 5 median planet effective BB temperature curves combined across all epochs.
Other Images in This Article
Show More
Copyright and Terms & Conditions
© 2025. The Author(s). Published by the American Astronomical Society.
Copyright ©
2025 Astronomy Image Explorer. All Rights Reserved.