Image Details
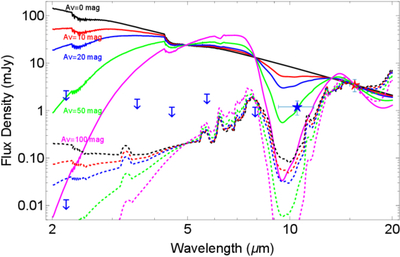
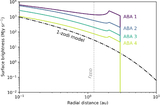
Caption: Figure 4.
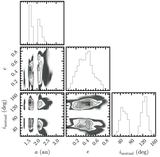
Limits from archival imaging at S1’s position. The solid, color-coded lines show a photospheric model for an M0III star (Teff = 3800 K) reddened by increasing levels of extinction, all normalized to 3.5 mJy at 15.5 μm (red star). The blue star denotes the flux density of the object denoted C1 detected by the VLT/NEAR experiment (K. Wagner et al. 2021). The dashed lines show the SED of a typical starburst galaxy or ULIRG (Arp 220) similarly reddened. Upper limits at the position of S1 come from observations at earlier epochs with Spitzer/IRAC (3–8 μm), 2MASS, and NACO (P. Kervella et al. 2016).
Other Images in This Article
Show More
Copyright and Terms & Conditions
© 2025. The Author(s). Published by the American Astronomical Society.