Image Details
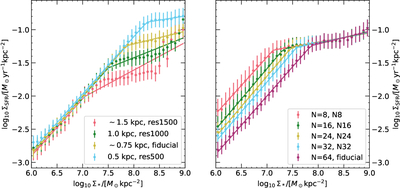
Caption: Figure 2.
Comparison of the modes of spaxels in the star-forming portion of the Σ*−ΣSFR diagram derived from maps with different spatial resolutions (left) and different smoothing scales (right). Points represent the ridges identified in each bin of Σ*, and lines of the same color represent the fit to those ridges. The uncertainties are approximated as the KDE bandwidth estimated via Scott’s rule.
Other Images in This Article
Copyright and Terms & Conditions
© 2025. The Author(s). Published by the American Astronomical Society.
Copyright ©
2026 Astronomy Image Explorer. All Rights Reserved.