Image Details
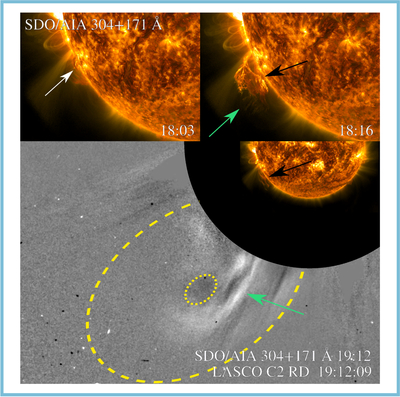
Caption: Figure 5.
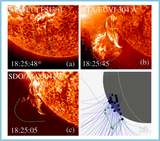
Evolution of the event observed by SDO/AIA on 2023 October 15: composite images of the splitting filament in 304 and 171 Å filters and the CME running-difference image from LASCO C2. In the upper-left panel the white arrow indicates the rising filament. In the upper-right and lower panels the green arrows indicate the eruptive segment, and the black arrows indicate the confined segment. The yellow dashed and dotted lines in the lower panel indicate the front of the CME and the cavity inside. An animation showing the filament rising and splitting from 16:00 to 23:20 UT is available in the online version. The animation includes different views. The first, running from 0 to 8 s into the animation, is of the SolO/EUI FSI 304 (left) and 174 Å (right) evolution. The second portion from 8 to 26 s is of the STA/EUVI 304 (left) and base difference 195 Å (right) evolution during the same period. Then, from 27 to 44 s, the SDO/AIA 94 (top left), 131 (top middle), 171 (top right), base difference 193 (bottom left), 211 (bottom middle), and 304 Å (bottom right) animation is presented, and a zoom-in high-cadence animation of the last four filters runs from 44 to 56 s of the video (from 17:50 to 18:35 UT). Lastly, from 56 to 62 s, the evolution from ∼16:00 to ∼23:10 in the FOV of STA/COR2 and LASCO/C2 is displayed.
(An animation of this figure is available in the online article.)
(An animation of this figure is available.)
The video/animation of this figure is available in the online journal.
Other Images in This Article

Copyright and Terms & Conditions
© 2025. The Author(s). Published by the American Astronomical Society.