Image Details
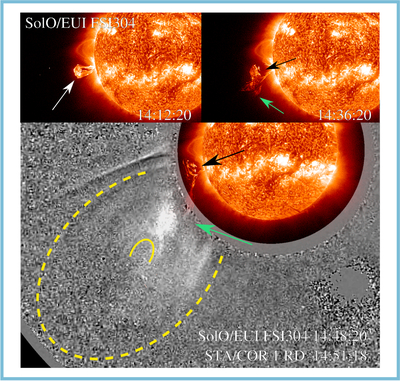
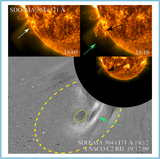
Caption: Figure 3.
Evolution of the splitting filament of 2023 February 5, as seen by SolO/EUI FSI304, and of the CME in a running-difference image from STA/COR 1. In the upper-left panel the white arrow indicates the rising filament. In the upper-right and lower panels the green arrows indicate the eruptive segment, and the black arrows indicate the confined segment. The yellow dashed and solid lines in the lower panel indicate the boundary of the CME and the horn-like structure at the top part of the filament, respectively. An animation showing the filament rising and splitting from 11:00 to 18:00 UT is available in the online version. Details idem Figure 1. An animation showing the filament rising and splitting from 11:00 to 18:00 UT is available in the online version. The animation includes different views. The first, running from 0 to 12 s into the animation, is of the SolO/EUI FSI 304 (left) and 174 Å (right) evolution. The second portion from 12 to 25 s is of the SDO/AIA 94 (top left), 131 (top middle), 171 (top right), base difference 193 (bottom left), 211 (bottom middle), and 304 Å (bottom right) evolution. The third portion, from 25 to 35 s, is a high-cadence zoom-in evolution of SDO/AIA 171 (top left), base difference 193 (top right), 211 (bottom left), and 304 Å (bottom right) during the splitting of the filament (14:00 to 15:00 UT). Last, from 35 to 44 s, the evolution from ∼11:00 to ∼18:00 in the FOV of STA/COR1 and LASCO/C2 is displayed.
(An animation of this figure is available in the online article.)
(An animation of this figure is available.)
The video/animation of this figure is available in the online journal.
Other Images in This Article
Copyright and Terms & Conditions
© 2025. The Author(s). Published by the American Astronomical Society.