Image Details
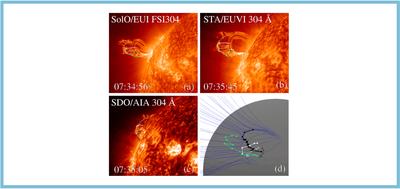
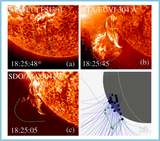
Caption: Figure 2.
Splitting filament on 2022 October 28 seen by SolO/EUI FSI304 (a), STA/EUVI 304 Å (b), and SDO/AIA 304 Å at 7:35 UT. SolO time corresponds to the time at Earth (date_ear) instead of the observation time, since the spacecraft received the image ahead at d⊙ = 0.44 au. Schematically the reconstructed areas are indicated by lines projected in the different images. The green and black dashed lines indicate the eruptive and confined segments, respectively. The gray lines show the arcs connecting both segments. In panel (d) the 3D positions of the triangulated pixels are shown with the open field lines (blue) in the area of the eruption, and the colors of the segments as indicated above. The gray sphere represents the solar surface at 1 R⊙, and to provide orientation the equator (teal), SolO meridian (yellow), STA meridian (pink), and SDO meridian (turquoise) are displayed. This figure is available online as an interactive figure, allowing different rotations and projections of the triangulated dots.
(An interactive version of this figure is available in the online article).
An interactive version of this figure is available.
An interactive version of this figure is available in the online journal.
Other Images in This Article

Copyright and Terms & Conditions
© 2025. The Author(s). Published by the American Astronomical Society.