Image Details

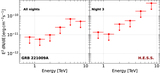
Caption: Figure 1.
Left: excess count map computed from the H.E.S.S. observational data taken on GRB 221009A presented in Table 1 with a 0.°1 oversampling radius (yellow circle). Middle: significance map computed from the H.E.S.S. excess count map of GRB 221009A. Right: significance distribution of the H.E.S.S. significance map entries in black and a Gaussian distribution fit in red.
Other Images in This Article

Copyright and Terms & Conditions
© 2023. The Author(s). Published by the American Astronomical Society.
Copyright ©
2025 Astronomy Image Explorer. All Rights Reserved.