Image Details
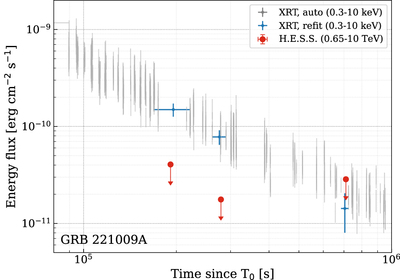
Caption: Figure 3.
The H.E.S.S. integral energy flux upper limits (red circles; 95% C.L.) are derived assuming an intrinsic E −2 spectrum. The automated XRT data (gray) are obtained from the Burst Analyser (Evans et al. 2010); multiple XRT observations around the H.E.S.S. observations are then combined and refit (blue, 1σ uncertainty). Note that the Burst Analyser assumes a larger value of intrinsic absorption than we find in our analysis and therefore returns a larger unabsorbed energy flux. The extension of the H.E.S.S. error bars in the x-direction, depicting the duration of the H.E.S.S. observations, is smaller than the size of the markers.
Other Images in This Article
Copyright and Terms & Conditions
© 2023. The Author(s). Published by the American Astronomical Society.