Image Details
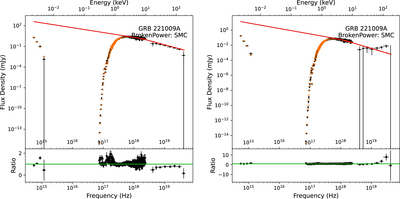
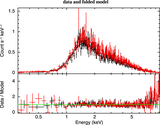
Caption: Figure 5.
Spectral energy distributions at T 0 + 4.2 ks and T 0 + 43 ks, containing BAT, XRT, and UVOT data. The top panel displays the best-fit unabsorbed broken power-law model (red) together with the data (black) and the data folded with the model (orange). The bottom panel shows the ratio between the data and the model folded through the instrument response.
Other Images in This Article
Show More
Copyright and Terms & Conditions
© 2023. The Author(s). Published by the American Astronomical Society.
Copyright ©
2026 Astronomy Image Explorer. All Rights Reserved.