Image Details
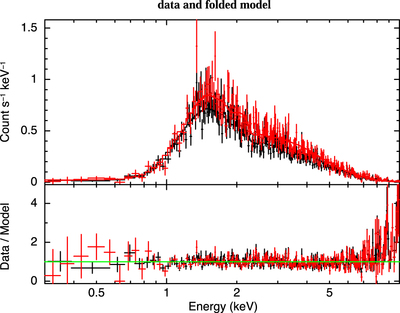
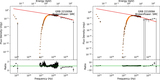
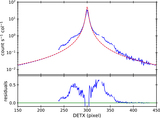
Caption: Figure 10.
A comparison of a PC-mode spectrum (black), in which dust has been correctly accounted for, and a mimicked WT-mode spectrum (red) of the same data, enabling us to quantify the impact of the dust on the WT-mode data.
Other Images in This Article
Show More
Copyright and Terms & Conditions
© 2023. The Author(s). Published by the American Astronomical Society.
Copyright ©
2026 Astronomy Image Explorer. All Rights Reserved.