Image Details
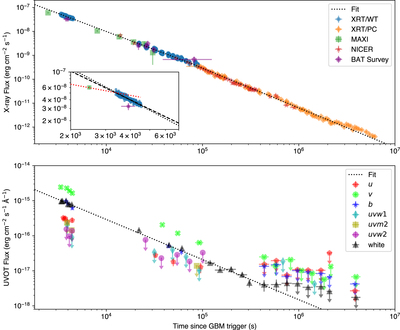
Caption: Figure 2.
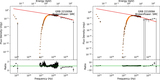
Combined X-ray and UV–optical light curve of GRB 221009A. The upper panel shows observed X-ray flux from MAXI, NICER, XRT (all 0.3–10.0 keV), and BAT (14–195 keV). BAT data are taken from detections of the afterglow in Survey data; note that the final BAT data point combines all observations integrated over 1 day. The dotted line shows a broken power-law fit to the MAXI, NICER, and XRT data. The inset figure shows the first MAXI, BAT, and XRT data, with the black dashed line indicating a fit to the XRT data alone, and red dashed line a fit between the first MAXI point and the first XRT detection. The lower panel shows 7 filter optical and UV data from UVOT as obtained after the subtraction of late-time template images. The dashed line shows a power-law fit to the white band data.
Other Images in This Article
Show More
Copyright and Terms & Conditions
© 2023. The Author(s). Published by the American Astronomical Society.