Image Details
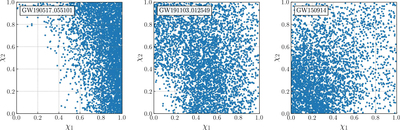
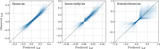
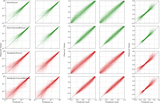
Caption: Figure 11.
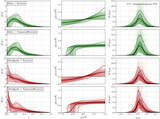
Spin magnitude posterior samples demonstrating the three classes of events discussed in Figure 10 above. The left-hand panel illustrates a confidently spinning binary, which is clearly identified as a member of the spinning “bulk” population and whose low effective sample count in the spike is therefore unimportant. The middle panel illustrates a “likely” spinning event, defined by having less than a fraction 1/200 of its posterior samples in the region χ 1, χ 2 < 0.1. The right panel, finally, shows an event belonging to neither category; these remaining events are used to generate the green points in Figure 10 above.
Other Images in This Article
Show More
Copyright and Terms & Conditions
© 2022. The Author(s). Published by the American Astronomical Society.