Image Details
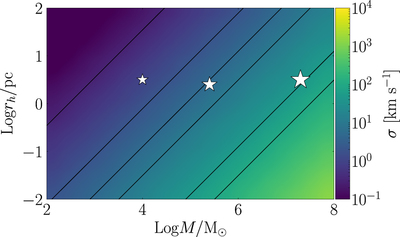
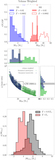
Caption: Figure 8.
Surface map showing the cluster velocity dispersion as a function of mass and half-mass radius. From left to right, black lines identify clusters with a velocity dispersion of 0.3, 2, 5, 10, 50, and 100 km s−1, respectively. The three black stars identify the typical values for Galactic YCs (Portegies Zwart et al. 2010), GCs (Harris 2010), and the Galactic NC (Feldmeier et al. 2014).
Other Images in This Article
Copyright and Terms & Conditions
© 2021. The American Astronomical Society. All rights reserved.
Copyright ©
2026 Astronomy Image Explorer. All Rights Reserved.