Image Details
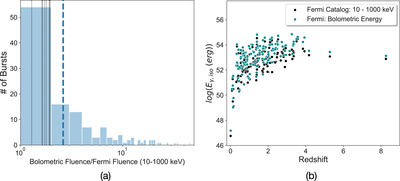
Caption: Figure 6.
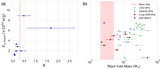
(a) The distribution of the ratio of bolometric fluence to the Fermi catalog fluence is shown in the left panel. The median value of the distribution is ∼3 and presented with blue dashed vertical line. The fluence ratio for the final eight GRBs listed in the Table 1 ranging between 1.3 and 2 are shown in black dotted vertical lines. (b) The isotropic burst energies estimated using the fluence in the energy range 10–1000 keV and bolometric fluence in the energy range 1 keV–1 GeV or observed energy range (LLE GRBs observed above 1 GeV) are shown in black and teal circles, respectively, with respect to the measured redshift.
Other Images in This Article
Copyright and Terms & Conditions
© 2021. The American Astronomical Society. All rights reserved.