Image Details
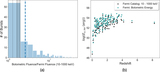
Caption: Figure 2.
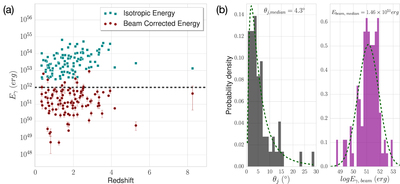
(a) The Eiso and Eγ,beam of the prompt emission of the 105 hyper-energetic GRBs are shown in green squares and red circles, respectively. The horizontal gray dashed line marks 1052 erg. (b) The distributions of θj and Eγ,beam of the 105 hyper-energetic GRBs are shown in the left and right panels of the plot, respectively. The log-normal fits to the respective distributions are shown in dashed green lines. The means of θj and Eγ,beam distributions are 2.°1 ± 0.°9 and (1.9 ± 4.2) × 1051 erg, respectively.
Other Images in This Article
Copyright and Terms & Conditions
© 2021. The American Astronomical Society. All rights reserved.
Copyright ©
2026 Astronomy Image Explorer. All Rights Reserved.